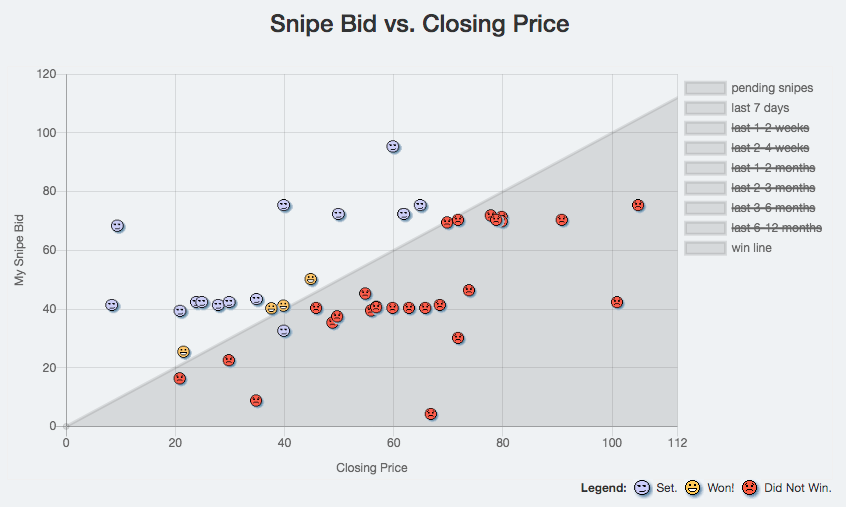
The Win Line chart is so named because it visually separates the wins from losses. The win line, the diagonal line spanning the chart, indicates the crossing point where the bid and cost on an auction are the same. With this chart, you can see where you stand on all of your auctions simutaneously, in a glance.
In mathematical terms, this is a "Bid vs. Cost" chart, or "y = x" chart, where "y" is your snipe bid, and "x" is the price of the auction.

Note: Due to the nature of statistics, the analysis tools are most most helpful for customers who buy often. The more data, the more helpful the chart.
In the legend on the right side of the chart, click items to disable (or re-enable) sets of auctions.
The bluish-gray icons (snickering)
![]() represent snipes that are pending on current auctions. These are snipes that have not executed yet.
represent snipes that are pending on current auctions. These are snipes that have not executed yet.
The yellow icons (smiling)
![]() represent snipes that you have won.
represent snipes that you have won.
The red icons (sad)
![]() represent snipes that you did not win.
represent snipes that you did not win.
In other words, how can I lose an auction when my bid was the highest?
Instinctively, your first thought is that all smileys over the Win Line should always be a yellow happy face, and all those below it, a sad face. This is not always the case; on occasion, you will see a sad face above the Win Line. This is due to the minimum bid increment. In other words, you cannot win $100 my bidding $100.01; you must bid 101.50, because the bid increment is $1.50.